An overview of our business
Our group comprises three main segments: Unifiedcomms, GlobeOSS and Captii Ventures.
Throughout 2025, Unifiedcomms continued to address mobile network operators and integrated telecoms service providers with application and platform software, turnkey solutions and systems and a variety of professional and managed services. In 2016 a unit within Unifiedcomms called PostPay was revitalised into a fresh start- up and given prominence as part of a wider reorganisation of the Unifiedcomms business. PostPay focuses mainly on providing advanced solutions for prepaid credit on a managed service model.
GlobeOSS meanwhile, has evolved into Malaysia’s premier provider of data intelligence and AI solutions, serving diverse sectors - telecoms, financial services, healthcare, public services and manufacturing.
Unifiedcomms operates primarily in the telecoms-tech markets of three regions: South East Asia (SEA), South Asia (SA) and the Middle East and Africa (MEA) while GlobeOSS focuses exclusively on SEA. For Unifiedcomms, with the exception of Malaysia, Singapore and Pakistan, where engagement with the customer is conducted directly by our own personnel, the majority of our engagements with customers are carried out through various sales channel partners. This two-tier sales and distribution approach enables us to cost-effectively reach customers within each region of focus and to tap into the local knowledge and insights of our partners to build and deliver compelling solutions.
Captii Ventures, the venture investment arm of our group, focuses primarily on the SEA market for start-up investment opportunities. Our venture investment business regularly interacts with other venture capital (VC) management companies in the region and participates in funding rounds as either lead investor or as a co-investor following the lead investor.
As at end-2025, there are a total of 209 people that are employed in our group. The majority of these personnel are located in Malaysia, where our operational headquarters is situated, while the rest work out of Singapore, Pakistan, Brunei, Thailand and Indonesia.
Challenging year with variations across business segments
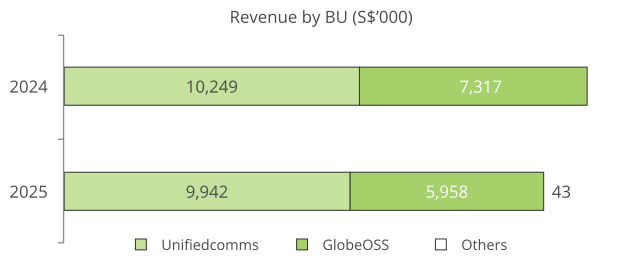
The group recorded consolidated revenue of S$15.9 million for the financial year 2025, a decrease of 9.2% as compared to the S$17.6 million achieved in 2024.
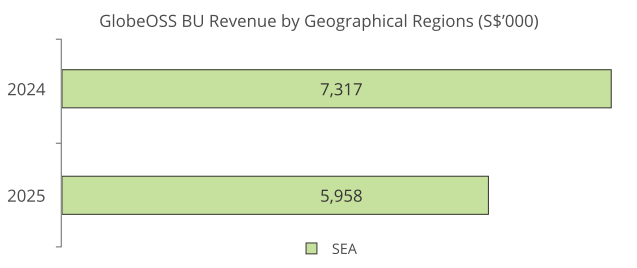
Both GlobeOSS and Unifiedcomms reported lower revenue relative to their 2024 performance. GlobeOSS recorded revenue of S$6.0 million in 2025, a decrease of 18.6% from S$7.3 million in the preceding year. Unifiedcomms registered a more moderate decline of 3.0%, with revenue of S$9.9 million compared to S$10.2 million in 2024.
The Others segment contributed S$0.1 million in rental income from the Group’s sole investment property in Malaysia, compared to nil in 2024.
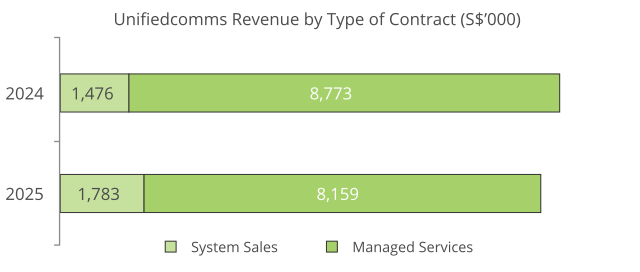
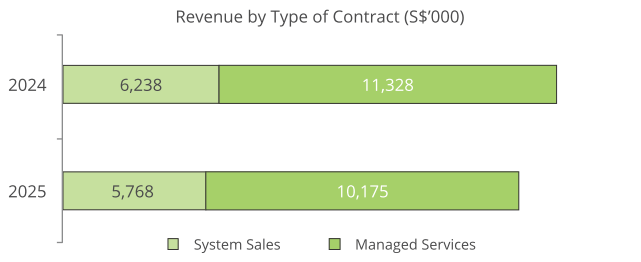
Lower revenue at Unifiedcomms was mainly due to a decline in managed service contract revenues, which dropped to S$8.2 million in 2025, from S$8.8 million in 2024. Although system sales contract revenues of this business in 2025 improved from S$1.5 million to S$1.8 million, this growth was insufficient to offset the decline in managed service revenues.
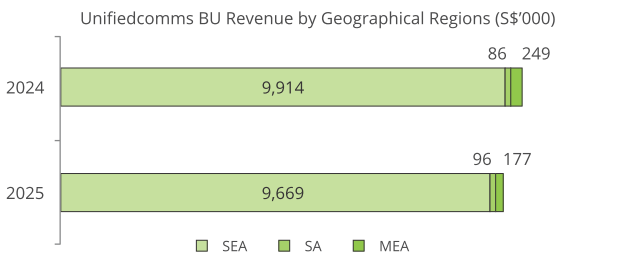
The Unifiedcomms customer base has traditionally been concentrated in the SEA region, and this remained unchanged in 2025. Unifiedcomms SEA region revenues accounted for 97.3% of total revenue recorded for the year.
GlobeOSS experienced a decline in both system sale and managed service contract revenues in 2025. System sale contract revenues declined to S$4 million in 2025 versus the S$4.8 million achieved in 2024. Managed service contract revenues declined to S$2 million in 2025 versus the S$2.6 million achieved in 2024.
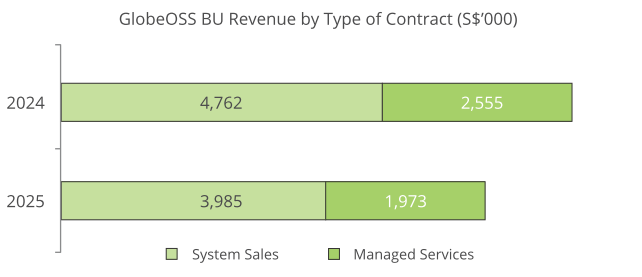
GlobeOSS continues to focus its system sale and managed service businesses in the SEA region.
Group revenue decline by contract type and region
At the group level, the revenue decline in 2025 was primarily driven by a 10.2% (S$1.2 million) decrease in managed service contract revenues across both Unifiedcomms and GlobeOSS, and a 7.5% (S$0.5 million) decline in GlobeOSS system sale contracts.
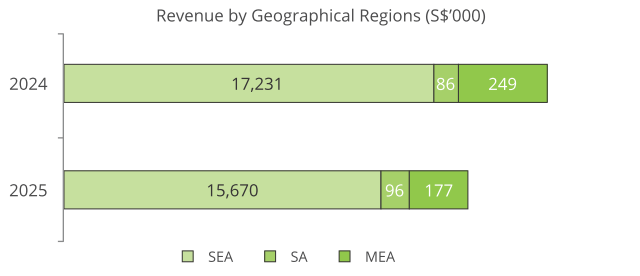
Geographically, the SEA region was the main contributor to the revenue decrease, with revenue falling from S$17.2 million in 2024 to S$15.7 million in 2025. In contrast, revenue from the SA and MEA regions remained largely stable at S$0.1 million and S$0.2 million respectively. SEA continues to be the Group’s largest market, accounting for 98.3% of total revenue in 2025.
Higher gross profit achieved, despite lower revenue
Although group revenue was lower in 2025, gross profit achieved for the year was higher compared to 2024.
Group gross profit for 2025 was S$10.2 million, up by S$0.8 million or 8.4% against what was recorded in 2024. The higher gross profit was primarily driven by an improved overall gross profit margin of 63.9% on group revenue, compared to 53.4% in the year before.
System sale gross profit rose to S$4.4 million in 2025 from S$4 million in 2024, while managed service gross profit increased to S$5.8 million from S$5.4 million. The improved margins on both system sale and managed service contracts more than offset the lower total revenue, driving the overall increase in group gross profit.
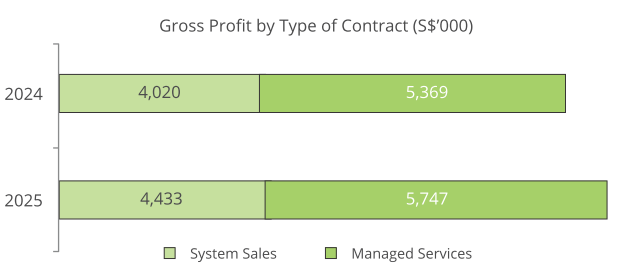
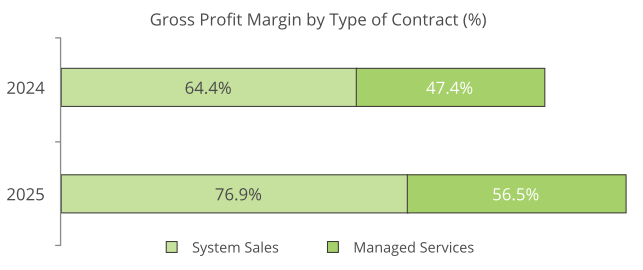
The average gross profit margin of system sale contracts improved to 76.9% in 2025, compared to 64.4% in 2024. This was primarily due to higher contribution from Unifiedcomms system sale contracts as well as an improved gross profit margin for GlobeOSS in 2025, driven by lower third-party costs. Meanwhile, gross profit margin earned on managed service contract revenues increased from 47.4% recorded in 2024 to 56.5% this year, primarily due to lower third-party costs on certain Unifiedcomms managed service contracts.
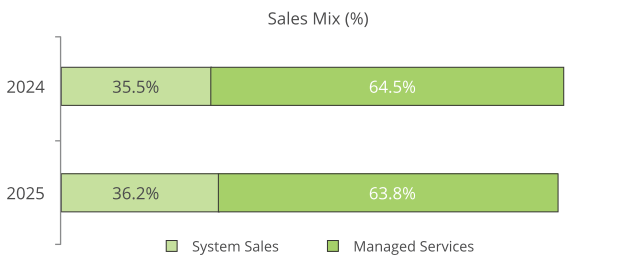
The sales mix of our group in 2025 continues to show more than fifty percent of group revenue being generated from managed service contracts. This year’s managed service contract revenues accounted 63.8% of group revenue, down from 64.5% in 2024. This was primarily due to a decrease in managed service contract revenues of the group, which declined by 10.2% from S$11.3 million in 2024 to S$10.2 million in 2025.
Lower total opex after exceptional items
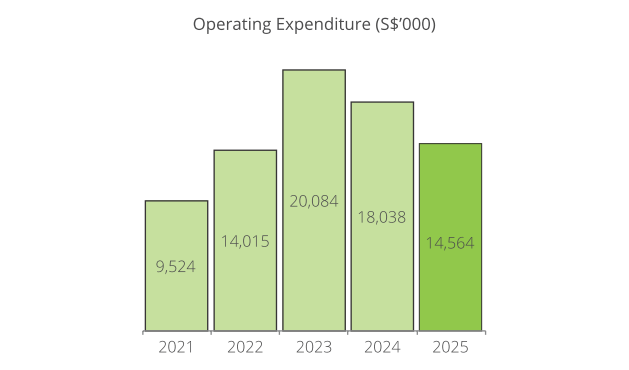
The group’s operating expenditure for the year decreased to S$14.6 million in 2025, compared to S$18 million in 2024. This reduction was primarily due to the absence of impairment loss on goodwill and a lower fair value loss on the Group’s venture investment portfolio.
Challenging market conditions led to a continued decline in the fair value of the group’s venture investments, resulting in a fair value loss of S$4.2 million in 2025, compared to S$6.2 million in 2024.
In 2024 the group recorded an impairment loss of approximately S$2.5 million on goodwill, intangible assets and plant and equipment. The impairment loss related to the Unifiedcomms cash-generating unit, where certain managed service contracts were assessed to produce lower-than-expected profitability and returns. This impairment loss has no cash impact.
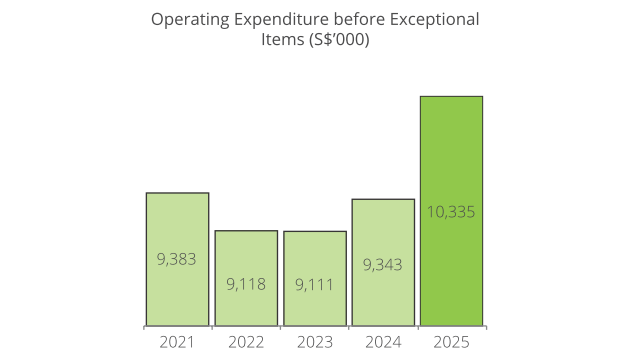
Excluding the impact of exceptional items, such as the fair value and impairment losses, the group operating expenditure for 2025 was S$10.3 million, an increase from S$9.3 million recorded in 2024. This increase was mainly attributable to higher technical support and distribution expenses associated with an increase in headcount.
Negative bottom line from large non-cash charges
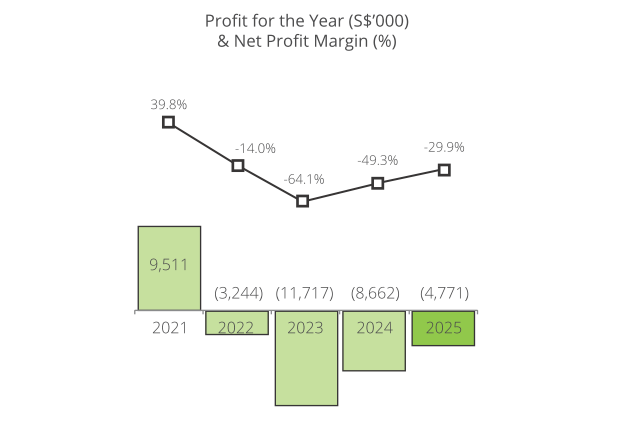
The group reported a net loss of S$4.8 million for 2025, an improvement of 44.9% from the S$8.7 million net loss in 2024. The narrower loss was largely due to a lower fair value loss on venture investment portfolio and the absence of impairment loss on assets, which together totalled S$4.2 million in 2025, compared to S$8.7 million in 2024. These exceptional losses had no cash impact on the business.
In terms of margins, our group recorded a negative net profit margin of 29.9% for 2025, as compared to the 49.3% recorded in 2024.
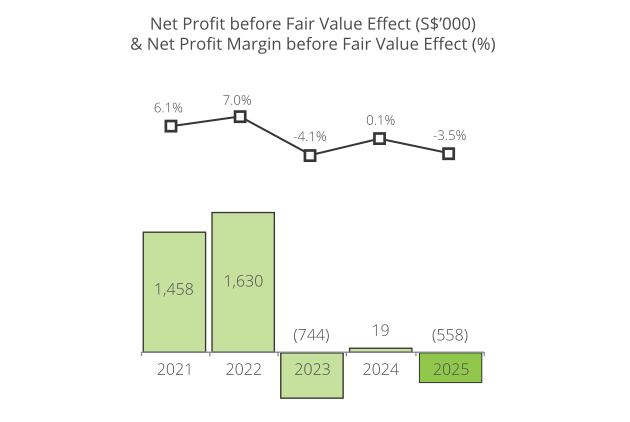
Excluding these non-cash exceptional losses, the underlying performance of Unifiedcomms and GlobeOSS is more apparent. Adjusted for these items, the group recorded an ‘adjusted’ net loss of S$0.5 million in 2025, in contrast with an ‘adjusted’ net profit of S$0.1 million in 2024. The decline in underlying business performance was primarily due to lower revenue and higher operating expenses.
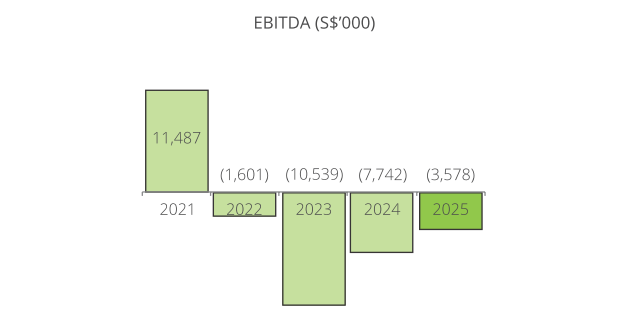
EBITDA for 2025 was negative S$3.6 million, largely reflecting the fair value loss on the Captii Ventures investment portfolio.
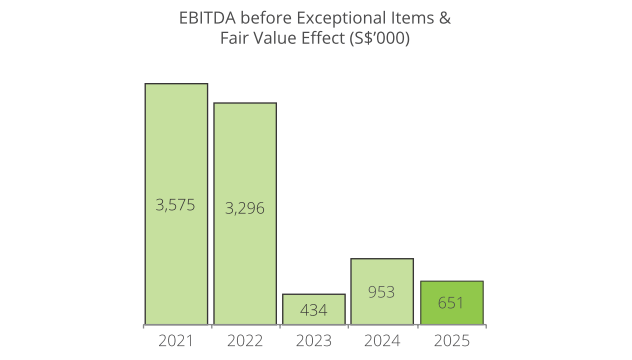
Removing the impact of these non-cash items, EBITDA before exceptional items stood at S$0.7 million, representing a decrease of 31.7% against what was achieved in 2024.
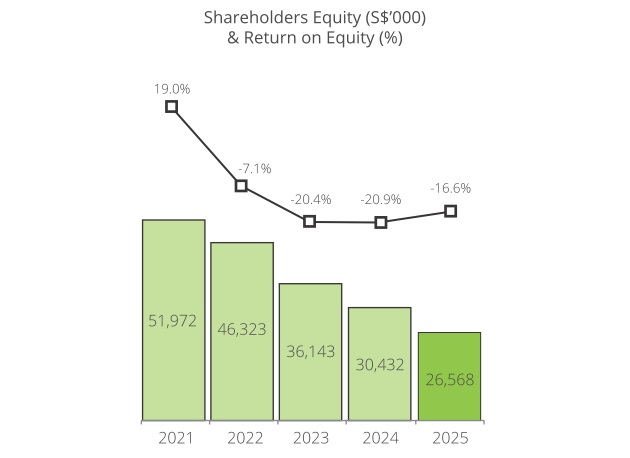
As a result of these exceptional losses, the group recorded a negative return on equity (ROE) of 16.6% for the year.
Investing in technology and innovation
As at end-2025, we continued to have sufficient capital to support both organic growth and strategic investment. This remains an essential element of our current business plan that target sustained and double-digit group profit growth, and a meaningful uplift in ROE.
Throughout 2025, our venture investment business evaluated several investment opportunities; however, none progressed to completion. As a result, the number of investees in the portfolio remained at five as at end-2025.
Reviewing the 2025 balance sheet
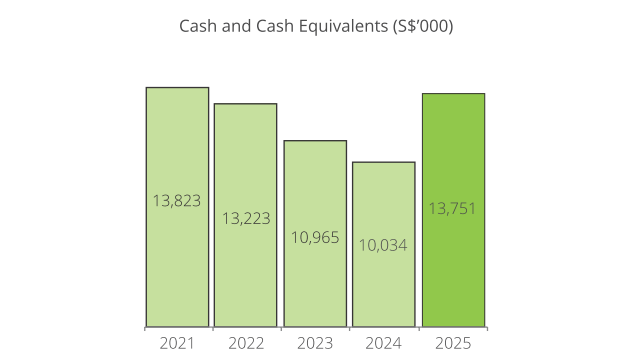
Turning to the group’s balance sheet: current assets decreased to S$23.6 million at end-2025 from S$24.3 million at end-2024. This decrease was mainly due to lower trade receivables and other assets following improved collections. The improvement in collections, after the repayment of S$0.9 million of interest- bearing borrowings, contributed into an increase in cash and cash equivalents of S$3.8 million. Consequently, the group’s cash and cash equivalents increased modestly to S$13.8 million at end-2025, from S$10.0 million at end of 2024.
Total non-current assets declined from S$16 million as at 31 December 2024 to S$11.8 million as at 31 December 2025, representing a decrease of 26.3%. This was mainly due to the reduction in other financial assets, following the significant non-cash fair value loss assessed on the venture investment portfolio.
Total liabilities of our group fell from S$5 million as at 31 December 2024 to S$4 million as at 31 December 2025. This decrease is mainly attributable to a reduction in borrowings following repayments made in 2025.
Reviewing movements in group cash
Our group’s net cash generated from operations was S$5.5 million in 2025, in contrast to the net cash used in operations of S$0.2 million in the previous year. This improvement was largely driven by a favourable change in working capital of S$4.8 million in 2025, in contrast to an unfavourable change in working capital of S$1.2 million in 2024, resulting from higher collections from trade receivables in 2025.
Our group’s net cash used in investing activities for 2025 amounted to S$0.6 million, compared to S$0.4 million in 2024. The lower cash outflow in 2024 was mainly attributable to proceeds from the disposal of a venture investment recorded during the year.
The group’s net cash used in financing activities for 2025 was S$1.4 million, compared to S$0.4 million in 2024. The lower cash outflow in 2024 was mainly due to drawdowns of borrowings during the year.
Business performance and outlook for 2026
In 2025, market conditions for system sales were expected to remain somewhat challenging. GlobeOSS system sale contract revenues declined by over 15% in 2025, while Unifiedcomms system sale revenues improved by 20%, highlighting the expected lumpy nature of system sale contracts. Meanwhile, growth in our managed service contract portfolio did not materialise, as both Unifiedcomms and GlobeOSS were unable to secure enough new contract revenues to offset the underperformance of certain existing contracts.
Looking ahead, significant uncertainty and lumpiness are expected in the contribution of system sale contracts to the group’s results. Strengthening the managed service contract portfolio and developing new sources of sustainable growth remain key priorities.
The outlook of Unifiedcomms and GlobeOSS continues to be challenging. The continued underperformance of certain major managed service contracts, intensified pricing pressures, and delays in securing new opportunities are expected to continue to impact the group’s business in 2026. Notwithstanding these challenges, significant steps have been taken since 2024 to strengthen the group’s operational and financial fundamentals.
On the business front, Unifiedcomms and GlobeOSS will continue to progress with contracts in hand, reinvest in product innovation and market diversification, and place emphasis on enhancing operational efficiencies and cost management.
At Captii Ventures, the group’s venture investment business, broader market conditions remain unfavorable.
With continued fiscal discipline and initiatives aimed at strengthening the group’s fundamentals, the group remains cautiously optimistic about its performance in 2026.
| Wong Tze Leng | Anton Syazi Ahmad Sebi |
|---|---|
| Executive Chairman | Executive Director |
17 March 2026